Intersection crashes affect health, work, and communities. See how medical care, lost income, and long-term impacts drive real costs.
Intersection collisions are often labelled “minor” at the scene. Yet when we step back and look at the data, we see a very different picture. Across Alberta and Canada, crashes at intersections generate medical costs, lost work time, and long-term health impacts that extend far beyond body shops and traffic tickets. We all carry these costs – as drivers, pedestrians, taxpayers, and families.
Canadian road safety research consistently shows that intersections are not just points where vehicles meet, but where economic, health, and social consequences accumulate.
| $36 BILLION Annual social cost of collisions in Canada, nearly 2% of national GDP |
Why Intersections Carry Disproportionate Risk
Intersections concentrate risk by design. They bring together opposing traffic flows, turning movements, pedestrians, cyclists, and time pressure, often within seconds. According to national collision data compiled by Transport Canada, roughly one in four reported road collisions in Canada occurs at an intersection.
This pattern is especially visible in urban regions such as Alberta’s Capital Region, where intersections are frequent, and traffic density is high. While most intersection collisions do not result in fatalities, they account for a substantial share of serious injuries and long-term harm.
| Strathcona County 2022 Collision Data • Total Reported Collisions: 1,522 (+24% from previous year) • Property Damage Only: 71% of all collisions • Collisions at Intersections: 52% of all incidents • Fatal Collisions on Highways: 11 deaths |
Transport Canada’s National Collision Database attributes approximately 80 per cent of reported collisions to driver-related factors. These include:
- improper turns, especially left turns across traffic
- failure to stop or yield
- speed inappropriate for conditions
- misjudging the actions of other road users.
The key point is not blame. The data shows that intersection risk emerges from split-second decisions in complex environments – conditions where prevention is possible.
“Dangerous road designs are extremely expensive. This research shows just how spread around the cost is – how much of the police and fire budget are taken up responding to collisions instead of fighting crime and fires, how much of the healthcare system is clogged up by it.”
— Reddit user u/pollettuce, citing CRISP Report analysis
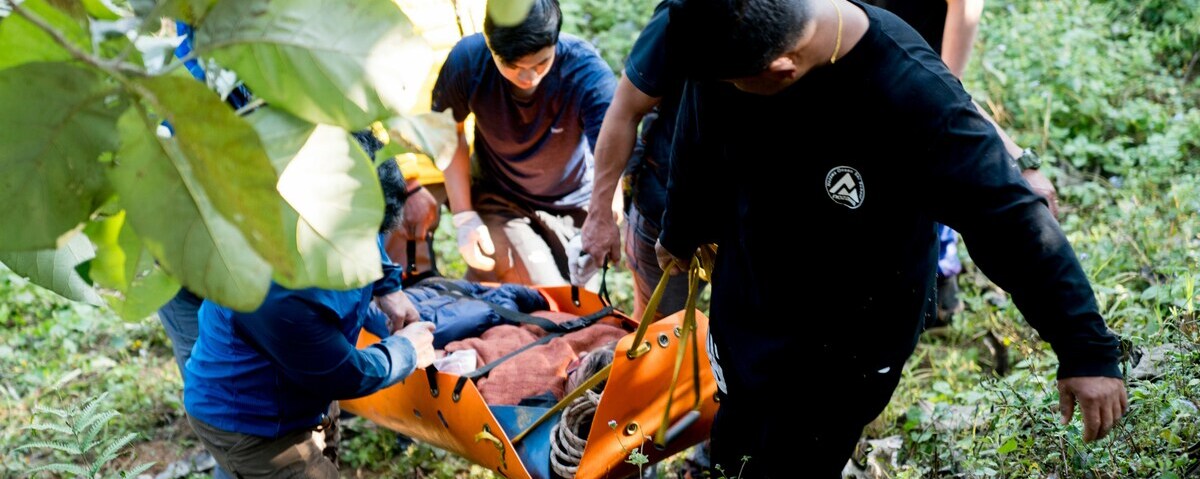
Medical Consequences That Persist Long After the Crash
Even when vehicle damage appears limited, medical involvement is common. Emergency department visits, imaging, and short-term treatment often follow intersection crashes. According to Canadian injury surveillance data, tens of thousands of people are hospitalised each year after road traffic injuries, with many more treated and released from emergency departments.
These initial encounters already generate costs – physician services, diagnostic tests, and early rehabilitation – often before insurance or fault is even discussed.
| $23,219 Average cost per road traffic injury survivor over 12 months (healthcare + productivity) |
Long-term injury and recovery
The more significant burden often appears later. Peer-reviewed Canadian research on road traffic injury survivors shows that injury severity, head trauma, and spinal involvement are the strongest predictors of long-term cost.
A large Canadian cohort study of 1,372 road traffic injury survivors (Momenyan et al., 2024), published in Clinical Epidemiology, estimated that:
Cost Category | Amount (2023 CAD) | Notes |
|---|---|---|
Median cost per injured person | $7,403 | Over 12 months |
Mean cost per injured person | $23,219 | Skewed by severe cases |
90th percentile cases | $49,538+ | Top 10% of costs |
Severe injuries (ISS >= 16) | $81,480+ | Within first year |
Maximum recorded cost | $704,160 | Single patient |
These figures include health care and lost productivity, adjusted to 2023 Canadian dollars. Importantly, the study found that psychological distress and reduced quality of life significantly increased costs among high-impact cases.
Many of these injuries originate at intersections, where side impacts and turning conflicts are common. Pain, mobility limitations, and follow-up care often persist long after vehicles are repaired.
“Side-impact crashes (common at intersections) are especially likely to cause serious chest and head injuries. These injuries frequently lead to months or years of medical expenses.”
— Insurance Institute for Highway Safety (IIHS)
Lost work time and productivity costs
When someone is injured in a collision, the economic impact rarely stops with medical bills. Time away from work, reduced productivity, and delayed return to normal duties create a second layer of cost.
National injury cost assessments conducted for Canada show that transport-related injuries cost approximately $3.6 billion in a single year when accounting for health care and productivity losses. Motor vehicle collisions alone account for more than half of this total.
| Transport Injuries in Canada – Parachute 2024 Data • Annual Deaths: 1,759 • Long-term Disabilities: 5,714 • Hospitalizations: 23,872 • Emergency Department Visits: 366,444 |
We see the ripple effect clearly. An injured worker may miss weeks of employment. A self-employed driver may lose income entirely during recovery. Family members may reduce their own work hours to provide care. These indirect costs often exceed repair bills and fines combined.
| $1.37 MILLION Daily collision costs in Saskatoon alone – approximately $500 million per year |
“The math becomes really interesting when you isolate individual corridors or intersections. The current design of 25th costs about $30,000 per day in collisions. 51st at Miller costs about $1,700,000 in collisions every year. If a $14M redesign reduces crashes, it is an EASY investment.”
— Reddit user u/pollettuce, Saskatoon collision analysis
Why “Minor” Collisions Are Rarely Minor
Most reported collisions in Canada are classified as property-damage-only. Yet this label can be misleading. Even without fractures or hospital admission, people involved in low-speed crashes frequently report delayed symptoms – neck pain, headaches, dizziness, or stress-related issues.
| Alberta Insurance & Reporting Data • Average property damage claim: $6,756 (2022) • PDO collisions reported (2021): 89,976 • New reporting threshold (Jan 2024): $5,000 (up from $2,000) • Previous threshold change: 2011 ($1,000 to $2,000) |
Insurance data and health studies show that:
- follow-up medical visits are common after low-impact crashes
- stress and anxiety can affect sleep, concentration, and work performance
- insurance premiums often rise after claims, regardless of injury severity.
A collision that seems resolved at the roadside may quietly generate costs for months. When multiplied across thousands of incidents each year, these “minor” events represent a substantial economic burden.
“A low-speed fender bender could be an example where both vehicles have combined damage under $5,000. It is important to remember that the cost of repairs applies to both vehicles as combined damage. Costs for auto parts and repairs have certainly risen over the past decade.”
— Vito Disciglio, Manager of Enforcement Services, Strathcona County
Families and Community-level Effects
The impact of intersection collisions extends well beyond individuals. Families absorb care responsibilities, adjust schedules, and navigate recovery alongside injured members. Children and older adults are particularly affected when mobility or independence is lost.
At the community level, collisions increase demand on emergency services, hospitals, rehabilitation clinics, and social support. Transport Canada estimates that the total social cost of collisions in Canada approaches $36 billion annually when measured in constant dollars. That equates to nearly $950 per person per year, or close to 2 per cent of the national GDP.
Metric | Value | Source |
|---|---|---|
Total social cost | $35.98 billion/year | Transport Canada 2020 |
Cost per capita | $946.65 | Statistics Canada |
Cost per licensed driver | $1,334 | Transport Canada |
Share of GDP | 1.92% | Statistics Canada |
Cost per VKT | $0.10 | Transport Canada |
These figures are built using population and economic data from Statistics Canada, combined with injury severity and health system utilization.
| Did You Know? > Collision costs are not abstract. They represent health care capacity, lost productivity, and years of healthy life removed from communities. > Transport injuries are the leading cause of injury death for Canadians under 45. > Despite progress, non-fatal injury reduction lags behind fatal injury reduction. |
Evidence on Who Bears the Highest Costs
Canadian research consistently shows that collision costs are not evenly distributed. Higher costs are associated with:
- older adults, due to slower recovery and higher complication rates
- pedestrians and cyclists, who face greater injury severity at intersections
- people with head, torso, or spine injuries
- individuals with lower pre-injury health or quality of life.
Road User Type | Mean Cost | 90th Percentile |
|---|---|---|
Pedestrian | $29,314 | $79,684 |
Motorcyclist | $28,545 | $59,696 |
Driver | $19,537 | $40,595 |
Passenger | $21,267 | $44,313 |
Cyclist | $17,832 | $37,495 |
A recent machine-learning analysis of Canadian collision survivors (Momenyan et al., 2024) found that injury severity score and level of consciousness were the strongest predictors of high economic cost. Age and employment status followed closely. These findings reinforce the importance of prevention at locations where severe injuries are most likely, including busy intersections.
Injury Severity (ISS) | Mean Cost | 90th Percentile | Impact vs. Minor |
|---|---|---|---|
Minor (<=3) | $8,534 | $20,723 | Baseline |
Moderate (4-8) | $10,759 | $24,043 | +26% |
Serious (9-15) | $32,014 | $92,724 | +275% |
Severe (>=16) | $81,480 | $227,274 | +855% |
What Actually Reduces Intersection Losses
The evidence does not point to a single solution, but it does highlight behaviours and conditions that consistently lower risk.
Research and enforcement data show that meaningful reductions come from:
- approaching intersections at speeds that allow full stopping
- completing full stops rather than rolling stops
- yielding predictably during turns
- accounting for winter traction and low-light visibility
- expecting errors from other road users rather than assuming compliance.
We all benefit when intersection behaviour is predictable. Small adjustments in speed and attention reduce the likelihood of severe outcomes, even when collisions occur.
“According to researchers, education is one of the least effective ways to increase safety – designs that enforce safe driving are much better. Wes Marshall’s ‘Killed By a Traffic Engineer’ is a good read if you want to dig into what has been empirically shown to reduce crashes.”
— Reddit user u/pollettuce, on evidence-based safety interventions
| 50% REDUCTION Edmonton’s road fatalities dropped ~50% over a decade while population grew 25% |
| Did You Know? > About one quarter of all Canadian road collisions occur at intersections > Transport injuries remain the leading cause of injury death for Canadians under 45 > Severe intersection injuries generate costs many times higher than minor crashes > The Value of Statistical Life used by Treasury Board of Canada is $8.15 million per fatality |
After a collision: general priorities
This is not legal guidance, but evidence-based sequencing:
– ensure immediate safety and seek medical assessment;
– document symptoms, even if they appear mild;
– monitor for delayed pain or cognitive effects.
Groups most affected
– older pedestrians crossing wide intersections;
– cyclists exposed during turning movements;
– drivers navigating winter conditions and low visibility.
A Shared Cost, a Shared Opportunity
Intersection collisions are not just traffic events. They are public health incidents, economic drains, and community disruptions. The data from Canada’s health and transport systems makes this clear.
When we understand the real cost (medical, economic, and social), prevention becomes more than a slogan. It becomes a measurable investment in safety, health, and shared well-being.
| $950 What every Canadian effectively pays per year toward collision costs |